Data Scientist with a background in healthcare and sales, specialized in Python and Power BI. Self-motivated curiosity to sift through large datasets for the most subtle of trends, and experienced in managing projects that utilize data-driven decision-making to solve complex multi-faceted problems. Attention to detail, as well as strengths in collaborating with groups and presenting compelling visualizations, makes me a valuable addition to any team.
CSS, HTML5, Power BI, JavaScript ES6+, Python, R, SQL, VBA
Takes ride sharing data, groups it by city type (rural, suburban, or urban), and creates a visualization using matplotlib.
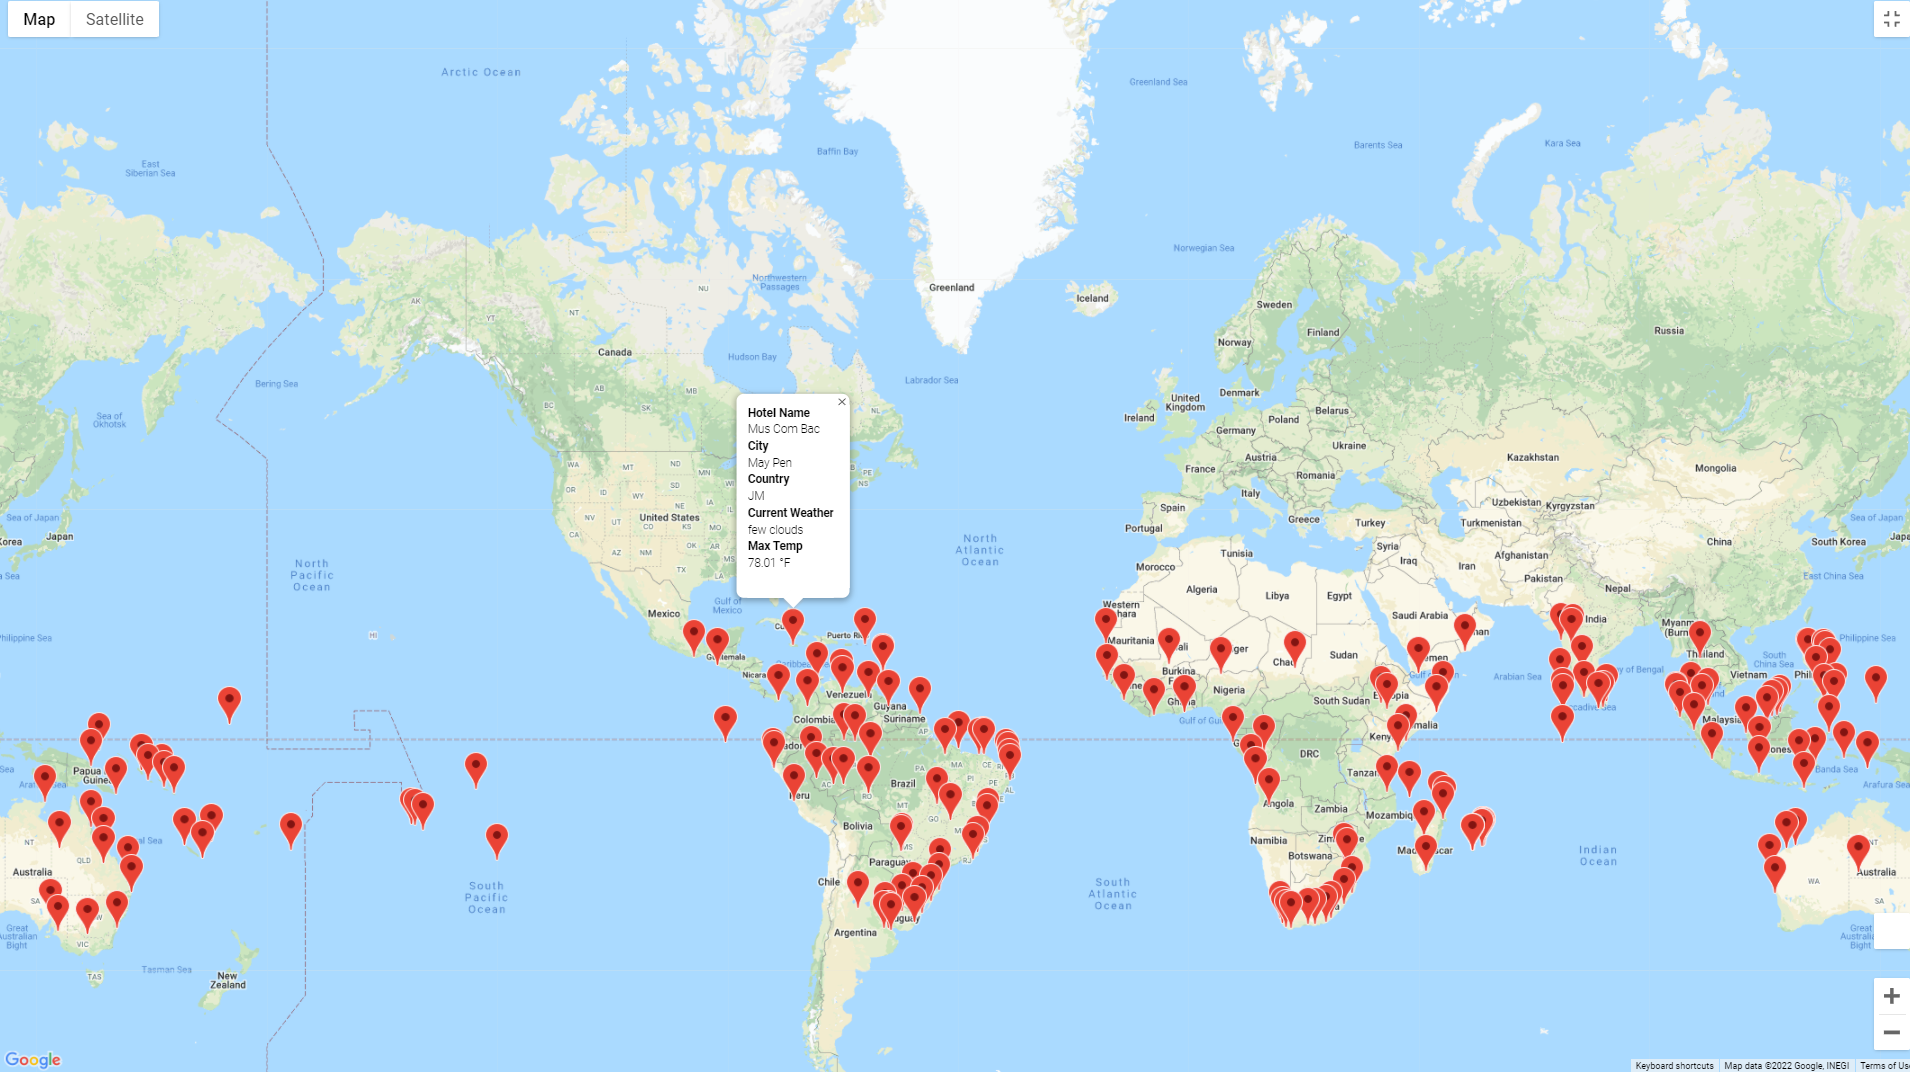
Code Matplotlib ChartUsing API information, generates weather from 2000 random cities. Also creates custom travel destination map from user input of weather preferences.
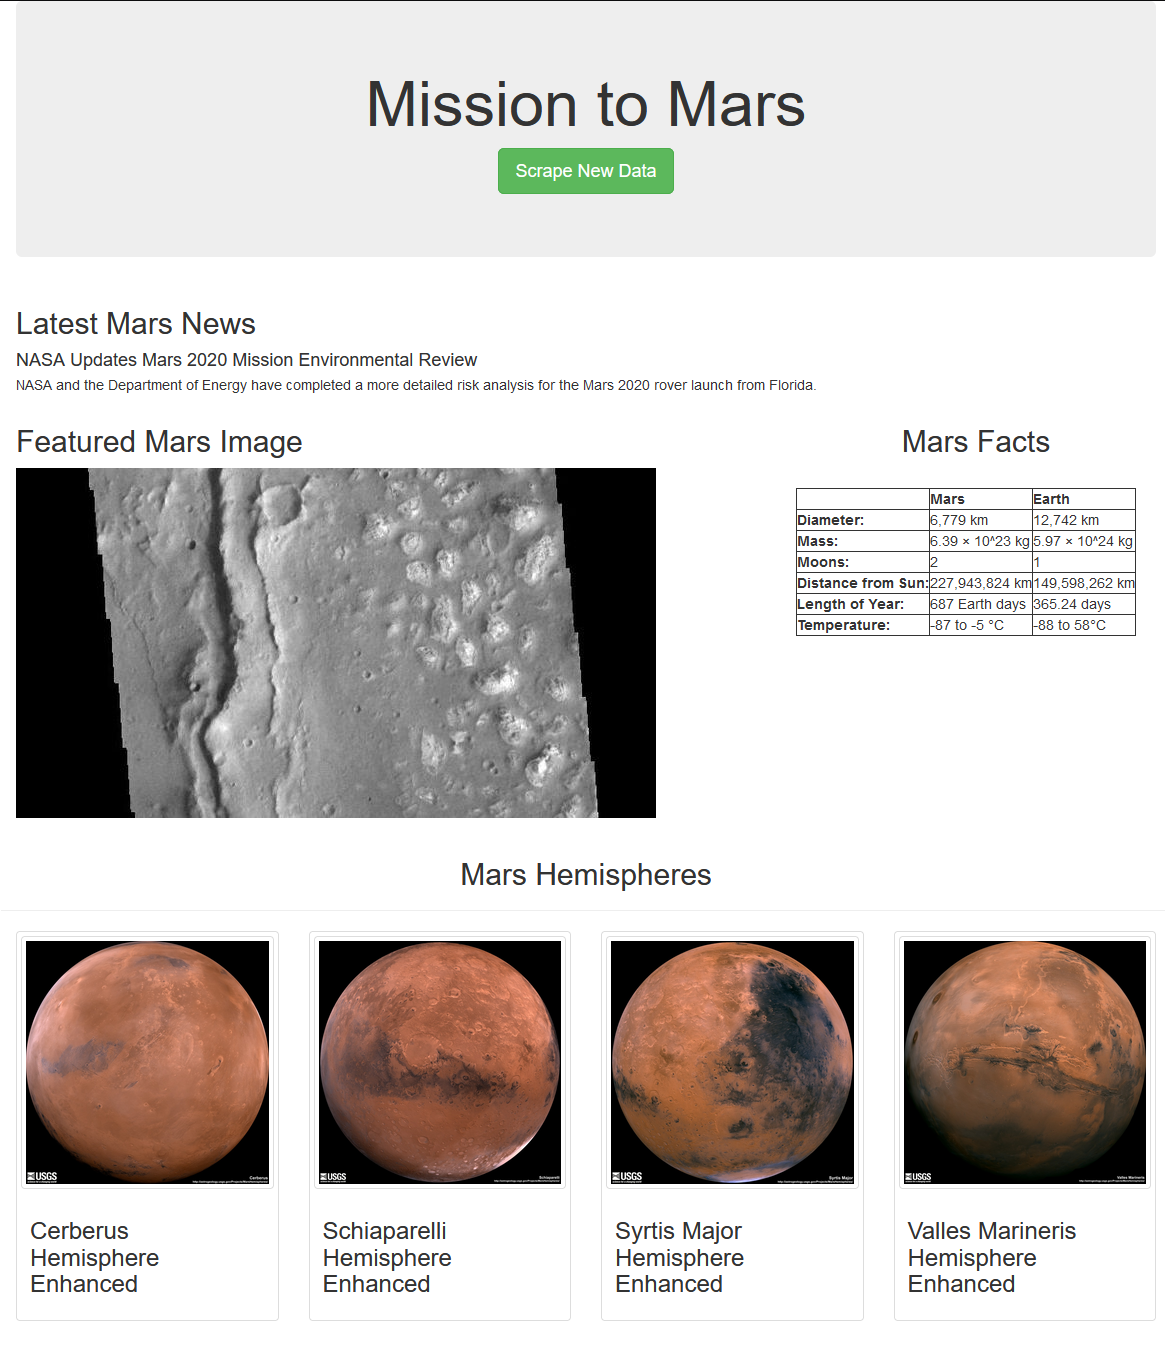
Code Travel Map ImageProject using web scrapping and Flask to create a webpage with information on Mars.
Code Website ImagePerforms statistical analysis (such as confidence tests) on car performance data using R.
CodeAnalysis of Amazon review data using spark, with AWS used as a file host.
CodeGroup analysis of chess moves by user rating, using machine learning and Tableau.
Code Google Slides Tableau Dashboard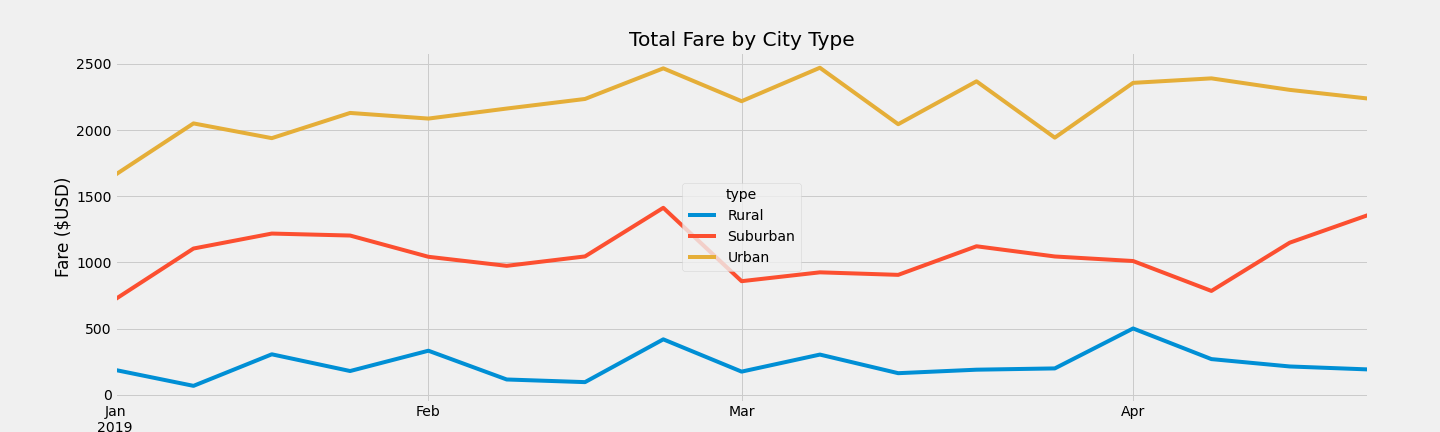